


Introduction
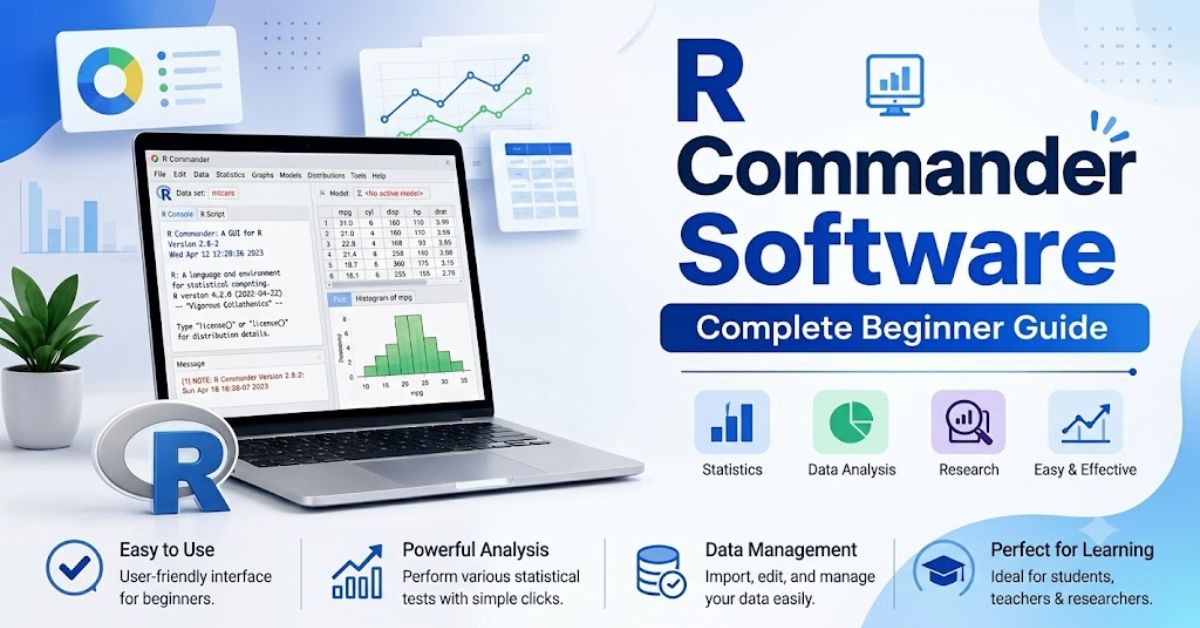
R Commander Software helps users simply perform statistical analysis. It works as a graphical user interface (GUI) for the R programming language. Users do not need to write complex code. They can click menus and run commands easily.
Many students and researchers use R Commander Software for data analysis. It reduces the difficulty of learning R programming. It also helps beginners understand statistics practically.
R Commander Software supports many statistical tools. It includes data handling, graphs, regression, and hypothesis testing. Users can import datasets and analyze them quickly.
This tool works inside the R environment. It extends R functionality with a user-friendly interface. Beginners use it to avoid coding errors and speed up learning.
In today’s data world, R Commander plays an important role. It bridges the gap between coding and statistical analysis. Many universities recommend it for teaching statistics.
What is R Commander Software?

R Commander Software acts as a graphical layer over R. It allows users to perform statistical tasks using menus. Users do not need to remember complex R commands.
Key idea of R Commander:
- It simplifies R programming
- It offers a menu-based interface
- It supports statistical analysis tools
- It helps beginners learn R easily
R Software uses the tcltk package in R. This package creates a GUI window where users can work. It provides a spreadsheet-like experience for data handling.
Researchers use it for quick analysis. Students use it for learning statistics concepts. It saves time and reduces coding mistakes.
R Commander Software also allows script generation. It shows R code for every action. This helps users learn real R programming step by step.
Why Use R Commander Software?
R Software is popular because it is simple and effective. Many beginners struggle with R code. This tool solves that problem.
Benefits of Commander Software:
- No need for advanced coding skills
- Easy navigation through menus
- Fast statistical analysis
- Built-in charts and graphs
- Helps in learning R programming
R Commander improves learning speed. It allows users to focus on concepts instead of syntax. It also reduces frustration for beginners.
Many educational institutes prefer R Software. It helps students understand statistics visually. It also builds confidence before learning full R coding.
Who Should Use R Commander Software?
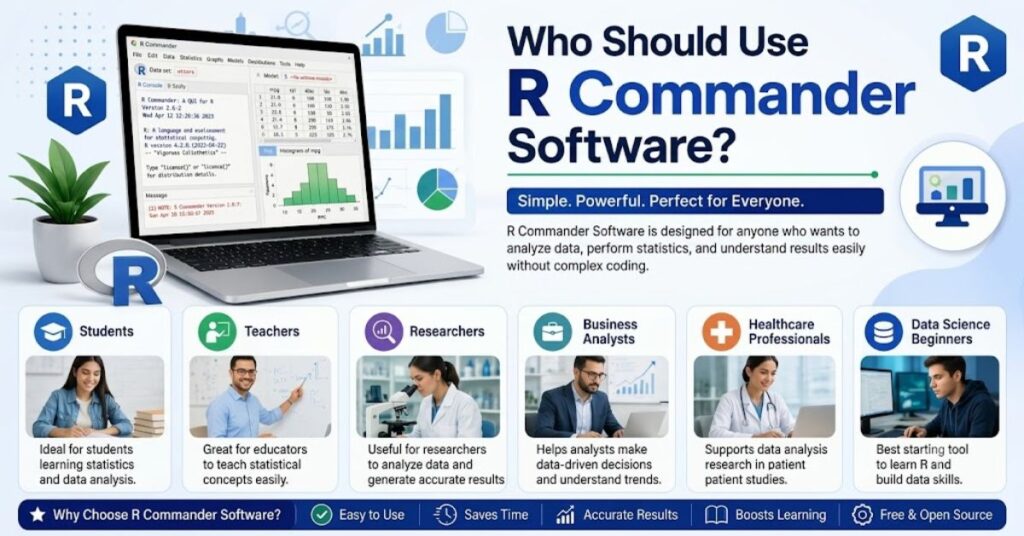
R Commander is useful for many types of users.
Ideal users include:
- Students learning statistics
- Researchers handling data
- Teachers explaining statistics
- Beginners in R programming
- Business analysts
Each group benefits differently. Students use it for assignments. Researchers use it for quick analysis. Teachers use it for demonstrations.
R Software is not only for experts. It is designed for non-programmers. It makes data analysis simple and accessible.
Basic Features of R Commander Software
R Commander offers many useful features. It supports statistical analysis and visualization.
Main features include:
- Data import and export
- Descriptive statistics
- Graph creation
- Regression analysis
- Hypothesis testing
- Data transformation
It also supports Excel and CSV files. Users can load datasets easily.
R Software generates R code automatically. This helps users learn programming while working.
It also provides error messages in simple language. This helps users fix problems quickly.
How R Commander Software Works
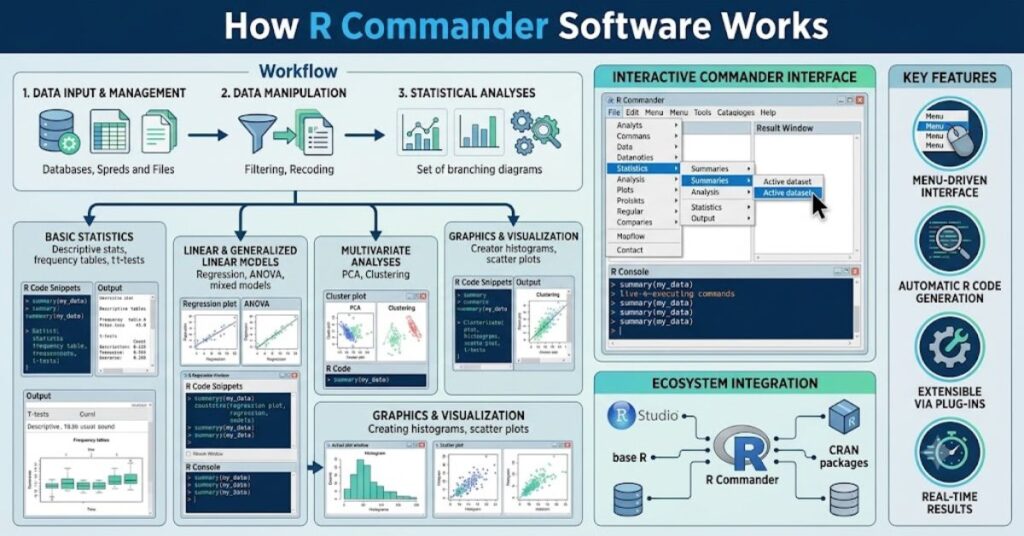
R Commander runs inside R. It opens a separate GUI window.
Working process:
- User opens R
- User installs R Commander package
- GUI window opens
- User selects menu options
- R executes commands in the background
The software translates clicks into R code. It runs commands instantly.
Users can also view script output. This improves understanding of statistical methods.
Importance of R Commander Software in Data Analysis
R Commander Software plays an important role in data analysis education. It simplifies complex operations.
Many professionals use it for quick analysis. It reduces time spent on coding.
Key importance points:
- Speeds up data analysis
- Reduces coding errors
- Helps learning statistics
- Provides visual results
It also helps in academic research. Many students use it for thesis work.
Limitations of R Commander Software
R Commander Software also has some limitations.
Main limitations:
- Limited advanced features
- Slower than direct R coding
- Less flexible for complex projects
- GUI may feel outdated
Advanced users prefer R coding directly. However, beginners still benefit greatly.
Summary of Part 1
R Commander Software helps users perform statistical analysis without coding. It provides a simple interface and supports many features. It is ideal for beginners and students.
R Commander Software Installation and Setup
R Software gives users an easy way to perform statistical analysis, but users must install it correctly before they start working.
In this section, we explain the full installation process in a simple, practical way. Many beginners face confusion during setup, so this guide helps you install R Commander step by step without errors.
R Commander
runs inside the environment, so users must install both R and RStudio (optional but helpful). After that, users install the R Commander package.
The installation process looks technical, but it becomes easy when users follow the correct steps.
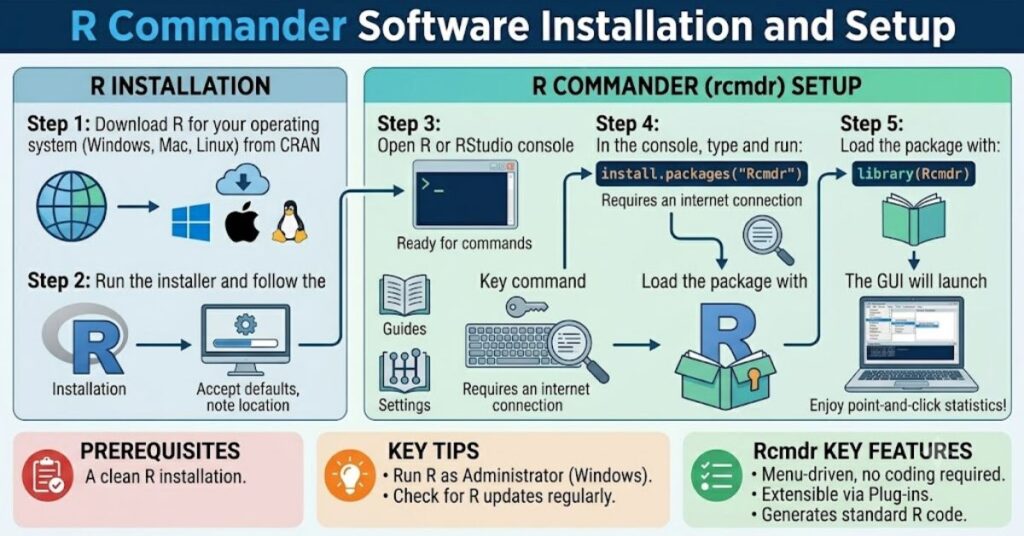
Users must first download R from the official CRAN website. After installing R, they can open it and run simple commands to install R Commander.
This setup allows the software to load a graphical interface that helps users work with data without coding.
R Software requires additional packages to work properly. These packages include tcltk, car, and other statistical libraries. R automatically installs these dependencies when users install the main package.
Once users install everything correctly, they can launch R Commander using a simple command. The interface opens in a separate window and allows users to perform statistical tasks easily.
Step-by-Step Installation Process
- Install R from the CRAN official website
- Install RStudio (optional but recommended)
- Open R console
- Run the installation command for R Commander Software
- Install required dependencies
- Load the package using the library command
- Launch GUI window
System Requirements for R Commander Software
R Software does not require a powerful computer. It runs smoothly on basic systems. However, users must meet minimum requirements to avoid performance issues.
A stable system helps R Software run without lag. Since it depends on R, system performance also affects the speed of analysis.
Most modern laptops and desktop computers can easily run R Commander. It supports Windows, macOS, and Linux operating systems.
System Requirements List
- Operating System: Windows 7 or higher, macOS, Linux
- RAM: Minimum 2GB (4GB recommended)
- Processor: Basic dual-core or higher
- Storage: At least 500MB free space
- R Installed: Latest version recommended
How to Launch R Commander Software
After installation, users can start R Commander easily. They do not need to open multiple tools or files. A single command opens the full interface.
R Software runs as a graphical window inside R. Users interact with it using menus and buttons. The system automatically executes commands in the background.
This makes R Commander very beginner-friendly. Users can focus on analysis instead of coding.
Launch Steps
- Open R console or RStudio
- Type command: library(Rcmdr)
- Press Enter
- Wait for the GUI window to load
- Start working with menus
R Commander Software Interface Overview
The interface of R Commander Software looks simple but powerful. It includes menus, data panels, and output windows.
Users can easily navigate through different options. The interface helps users understand statistical tools without writing code.
R Commander displays results in a structured format. It also shows R commands in the background, helping users learn programming step by step.
Main Interface Components
- Menu bar for selecting actions
- Data view window
- Output window for results
- Script window for R code
- Toolbar for quick actions
Working of R Commander Software Interface
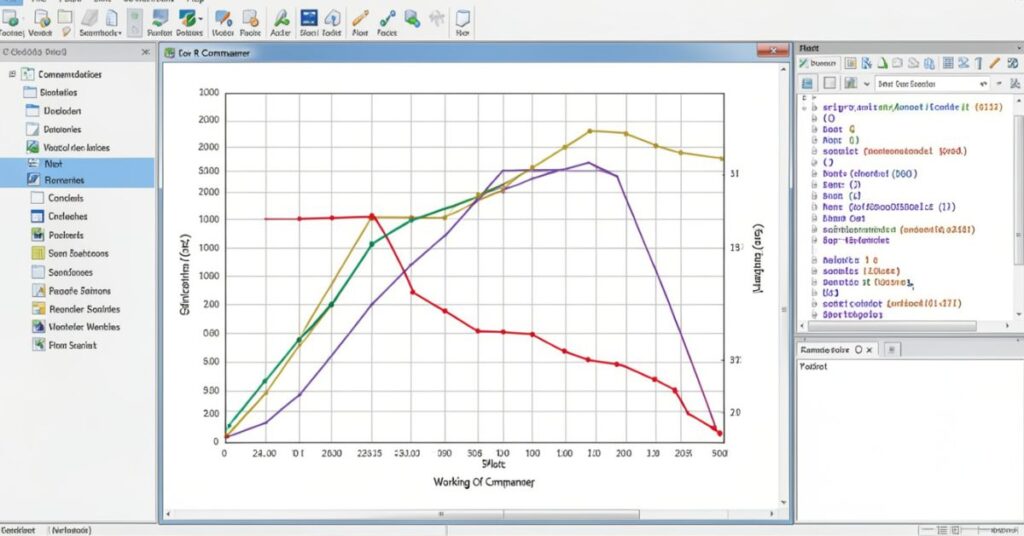
R Commander Software works by converting user actions into R code. Every click generates a command in the background.
Users can see these commands in the script window. This helps them learn real R programming without stress.
The interface acts like a bridge between coding and visual analysis. It improves learning speed and reduces confusion.
How the Interface Works
- User selects menu option
- Software generates R command
- R executes command
- Results appear in output window
- Code appears in script window
Advantages of Installation Process in R Commander Software
The installation process of R Commander is simple compared to many statistical tools. It does not require complex configuration.
Users only install R, then install the package, and launch it. This simple process makes it beginner-friendly.
R Commander also updates easily through R packages. Users can upgrade it without reinstalling everything.
Key Advantages
- Simple installation steps
- Automatic dependency setup
- Free and open-source tool
- Cross-platform support
- Easy updates through R
Common Installation Problems and Solutions
Some users face errors during installation. These issues usually happen due to missing packages or outdated R versions.
R Commander requires proper package installation. If a package fails, users must reinstall it or update R.
Most problems are easy to fix. Users can solve them by following correct commands.
Common Issues List
- Missing tcltk package
- Outdated R version
- Internet connection issues
- Package installation failure
- GUI not opening
Summary of Part 2
R Commander installation is simple if users follow the correct steps. The interface is easy to understand, and setup does not require advanced knowledge.
Once installed, users can start analyzing data quickly using a graphical interface instead of coding.
R Commander Software Features and Uses
R Commander gives users a powerful set of tools for statistical analysis. It simplifies complex data work and helps users complete tasks without writing long R code.
In this section, we explore the main features and real-world uses of R Commander in detail.
R Commander supports a wide range of statistical methods. Users can analyze data, create graphs, and perform tests using simple menu options.
It reduces the need for manual coding and improves the accuracy of results.
R Commander Software Advanced Features and Usage
R Commander Software offers advanced tools that help users perform deeper statistical analysis.
After learning basic functions, users can explore these advanced features to handle complex datasets. R Commander allows users to move beyond simple analysis and work on real research problems.
R Commander supports advanced regression models, multivariate analysis, and data transformation tools.
It gives users full control over statistical testing without requiring heavy coding knowledge. This makes R Commander useful for both beginners and intermediate users.
The software also connects with R scripts. Users can edit and run advanced commands directly.
This feature helps users gradually shift from GUI-based work to full R programming. It builds strong analytical skills step by step.
R Commander also supports data filtering and variable manipulation. Users can clean datasets, remove errors, and prepare data for analysis. This process improves the accuracy of research results.
Advanced Features
- Multiple regression analysis
- Logistic regression models
- ANOVA tests
- Data transformation tools
- Outlier detection
- Script editing and execution
- Advanced plotting options
R Commander Software vs RStudio Comparison
Many users compare R Software with RStudio. Both tools work with the R language, but they serve different purposes. R Commander focuses on simplicity, while RStudio focuses on advanced coding.
Software uses a menu-based system. RStudio uses a full coding environment. Beginners prefer R Commander because it reduces complexity.
RStudio gives more flexibility, but it requires programming knowledge. R Commander gives faster results for basic tasks.
Comparison Table
| Feature | R Commander Software | RStudio |
| Interface | GUI (Menu-based) | Code-based |
| Ease of Use | Very easy | Moderate to hard |
| Learning Curve | Low | High |
| Flexibility | Limited | Very high |
| Best For | Beginners | Advanced users |
| Coding Required | No | Yes |
R Commander Software Real-World Applications
R Commander Software plays an important role in education, research, and business analytics. Users apply it in different fields for data-driven decision-making.
In education, teachers use it to teach statistics simply. Students learn concepts like mean, median, regression, and probability using R Commander Software without writing code.
In research, scientists use it to analyze survey data, experiment results, and statistical models. It helps them generate quick results and visual reports.
In business, analysts use R Software to understand customer behavior, sales trends, and market data. It supports decision-making with clear statistical output.
Applications of R Commander
- Academic research projects
- Student statistical learning
- Business data analysis
- Medical research studies
- Social science surveys
- Market trend analysis
- Educational demonstrations
R Commander Software Advantages
R Commander Software offers many benefits that make it popular among beginners. It reduces complexity and improves learning speed.
The biggest advantage of R Commander Software is its simplicity. Users do not need coding skills to perform advanced analysis. They can use menus and dialogs to complete tasks quickly.
It also improves learning because it shows R code in the background. This helps users understand programming gradually.
Key Advantages
- Easy-to-use interface
- No coding required
- Fast statistical analysis
- Built-in visualization tools
- Helpful for learning R
- Free and open-source
R Commander Software Limitations
Even though R Commander is powerful, it has some limitations. Users should understand these before choosing it for advanced projects.
Software does not support very complex custom models. Advanced users may find it less flexible than direct R programming.
It also depends on R packages. If packages fail, the software may stop working properly.
Main Limitations
- Limited advanced customization
- Slower than direct coding
- GUI looks basic
- Not ideal for large-scale automation
- Dependency on R packages
R Commander Software Best Practices
Users can improve their experience by following some best practices. These tips help them work faster and avoid errors.
R Commander Software works best when users organize their data properly. Clean datasets produce better results.
Users should also save scripts regularly. This helps them reuse commands and learn R programming effectively.
Useful Tips
- Always clean data before analysis
- Save scripts frequently
- Learn generated R code
- Use small datasets for practice
- Update R and packages regularly
Conclusion
R Commander Software provides a simple way to learn and perform statistical analysis. It bridges the gap between coding and non-coding users. Beginners can start with menus and gradually learn R programming.
This guide covered the installation, features, uses, advantages, and limitations of R Commander.
It remains one of the best tools for students and researchers who want easy statistical analysis without coding complexity.
FAQs
1. What is R Commander Software used for?
R Commander is used for statistical analysis, data visualization, and learning R programming through a graphical interface.
2. Is R Commander free?
Yes, R Software is free and open-source.
3. Do I need coding skills for R Software?
No, R Software works without coding, but it helps users learn R gradually.
4. Can I use R Commander for research?
Yes, researchers use Software for data analysis and academic studies.
5. What is the difference between R and Software?
R is a programming language, while R Commander is a GUI that makes R easier to use.
6. Is R Commander good for beginners?
Yes, it is one of the best tools for beginners in statistics and data analysis.
7. Can R Commander create graphs?
Yes, it can create multiple types of statistical graphs and charts.